
Information graphics, aka “infographics,” are used to visually present statistical information in a compelling and easy-to-understand manner. For family businesses, infographics are useful primarily for the overall impact they may have – especially if they encourage the pursuit of further knowledge or action. There are family business-specific sources that bring these statistics to life, and other sources, such as the federal government. Sometimes these stats show improvement in a previously troubling area, yield an interesting bit of knowledge, or spotlight an issue the family business owner has been ignoring up to this point.
Statistics matter just as much, if not more, for businesses that are family-owned. Businesses have used statistics to track successes and predict future performance in order to set goals for centuries. For instance, they may measure which items in their inventory sell the most units, and compare them to the profit margin of other items to adjust prices or production. They may also survey clients or prospects on their wants, needs and problems to better direct the business to meet those expectations, and solve or prevent problems. However, family businesses tend to lean toward informality and unwritten procedures and policies. Without a baseline (such as the knowledge that 25% of your customers currently pay later than 60 days in your accounts receivables), it would be difficult to know if and by how much the situation is improving or worsening over time – and that eventual discovery may come after it’s too late to fix the problem.
The #1 family business statistic to know and use. Here’s a hint: The majority of family business owners who read the following need to act on what it implies. Although it comes across as a broken record, there is good reason for this infographic to be so prevalent.
Survival of Family Businesses into the Second Generation and Beyond:
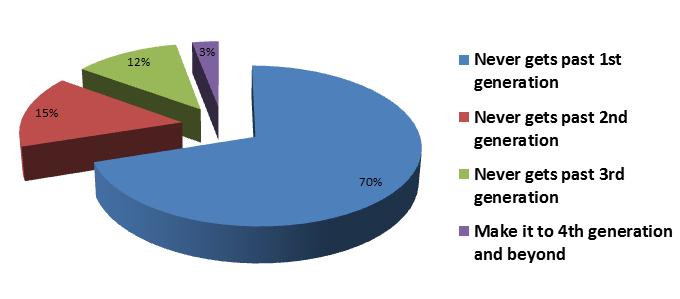
There it is – that very large slice of pie chart, indicating the 70% of family businesses that never make it to the second generation. Most family business founders intend for the business to be passed on, yet so many do not make it. The remaining 30% make it further, but half of those do not get past the 2nd generation. Of the remaining 15% of the total, only 3% of the total make it to the 4th generation or beyond. The action that should be taken by most of the 70% can be found in the next infographic.
Family Businesses and Succession Plans:
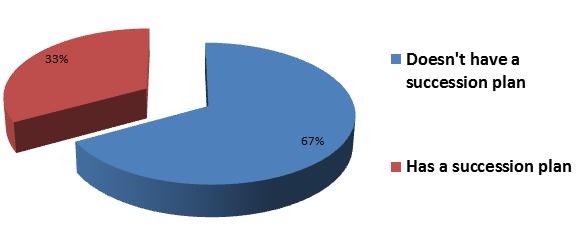
Only 33% of family businesses have actual written succession plans. Most family business infographic sources correlate the 67% of family businesses without a succession plan with the 70% that never make it past the first generation.
Other statistics and why they matter. Many family business statistics come from sources such as: PricewaterhouseCoopers’ 1) Family Business Survey 2012, 2) Kin in the Game article 2010/2011, and 3) US Family Businesses article 2012/2013; MassMutual’s 1) FamilyPreneurship Study 2010 and 2) Business Owners Perspectives Study 2011; and virtually everything from the Family Firm Institute. The MassMutual FamilyPreneurship Study, for example, offers a few more infographics that further support the need for family business leaders to make plans as opposed to just assumptions.
First is the issue of who may be named as successor. According to this study, approximately 52% of family business owners believe that they will be passing on the business to the next generation to own and run. Yet the following also shows that the family members may not show as much interest in the business as is assumed:
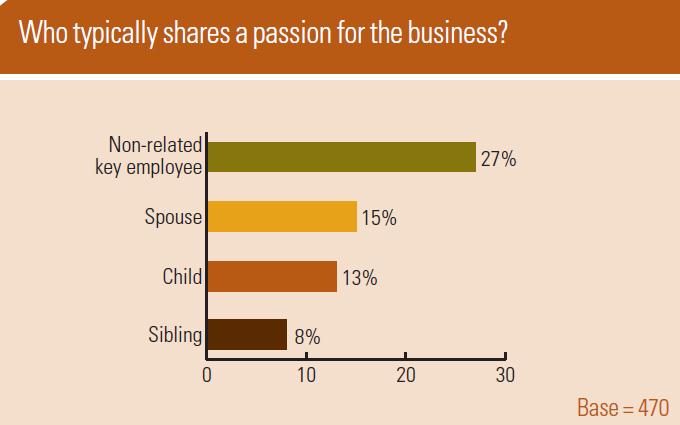
Overwhelmingly, a non-related key employee shares the passion for the business more than the children – this type of information could spur family business owners to open communications more with their family members and non-family management to better plan for leadership succession.
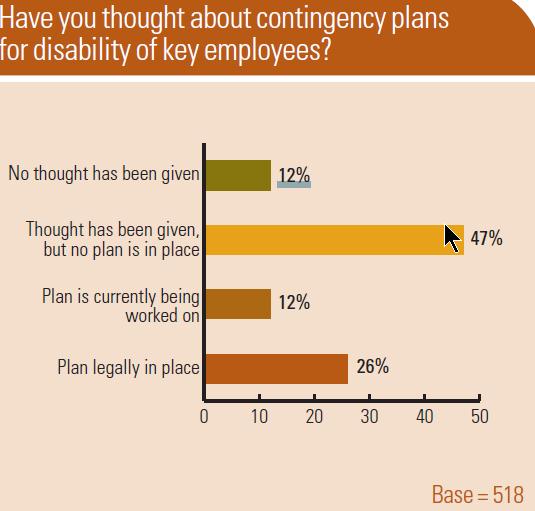
Next is the succession-related issue of how key positions (not just the next CEO) will be filled in the case of disability. It’s estimated that one in three Americans entering the workforce today will become disabled before they retire, but the following infographic on contingency plans shows that only 26% of family businesses have put a plan in place. Though their intentions may be good, the 47% that thought about a plan won’t find intention of much use.
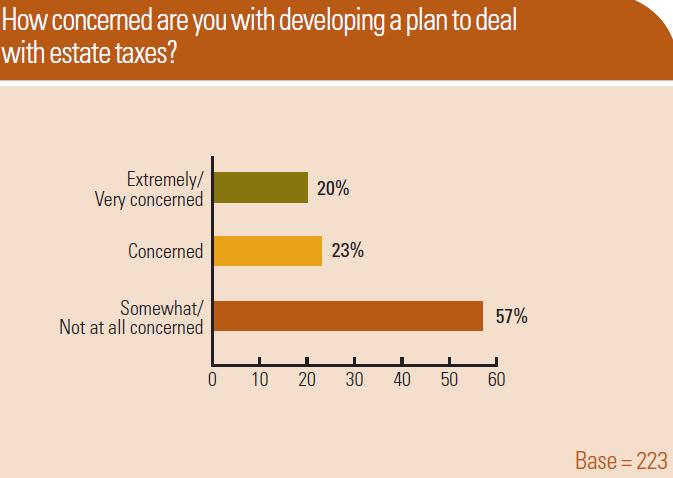
Finally the attitude toward one of the key financial aspects of the business is reviewed – primarily the need to address estate taxes. While this infographic only refers to level of concern and not percentages of family businesses that actually have an estate plan, it’s clear that feelings and attitudes play a large part in how family businesses are run and can therefore affect their success. It would be logical to assume that only those business owners who rate themselves as “extremely” or “very” concerned would have or be in the process of making an estate plan – and that would be only 20%.
Statistics can help analyze the past or better plan for the future, but if no action is ever taken then they might be no more than numbers and colorful graphics.
Contact me at rkvalo@curchin.com or 732.747.0500 to find where your family business falls in key infographics and the next steps you should take.